


CFC Data Brief: 2023-24 State Assessment Results
DPI lowered standards and muddied the picture of student progress across the state
By: Spencer Schien
Last Tuesday, the Wisconsin Department of Public Instruction (DPI) released statewide assessment results for the 2023-24 school year, including Forward Exams for students in grades 3-8 and the ACT test series for high school students. In this post, we will try to help put these changes and the resulting test results in context.
Notably, this year’s release is the first to come after DPI made changes both to how all state tests (Forward for grades 3-8, and ACT for HS) are evaluated, as well as to the Forward Exam itself. We’ve previously shared our concerns with the secretive, closed-door process by which these changes were made. Now that the full statewide results are available, we’re able to show how these harmful changes have muddied the picture of student outcomes and school performance, both in Milwaukee and statewide.
These changes mean that scores this year are not directly comparable to past years’ results, and they make it more difficult for stakeholders to identify trends and answer important questions. How well are students recovering from pandemic-era school closures and disruptions to learning? What is the impact of implementing Act 20, Wisconsin’s Right to Read literacy Bill? We don’t know this year because of DPI’s decision to lower standards.
And, we are already getting indications from DPI that this mess is only likely to get worse with next month’s release of School and District Report Cards - with further manipulation of the results to try to address the worst of the issues created by these changes.
Students, families, and educators deserve a rigorous, high bar for student expectations, and honest, transparent, and clear information about how our state’s schools are performing. This year’s results only further demonstrate that DPI is failing to meet the standard.
Key Findings
More Students Meeting Lower Standards: Under new, lower standards for student learning, just over half of Wisconsin’s students earned a rating of Meeting or higher on the spring 2024 state assessments.
Statewide, in 49% of students met new state standards in English Language Arts (ELA), and 50% of students met these standards in Math.
In Milwaukee, across all sectors 25% of students met new state standards in ELA, and 21% of students met new state standards in Math.
Lowered Expectations: The state’s definition of meeting expectations no longer aligns with rigorous national benchmarks for what students should know and be able to do in order to be ready for college or for a career.
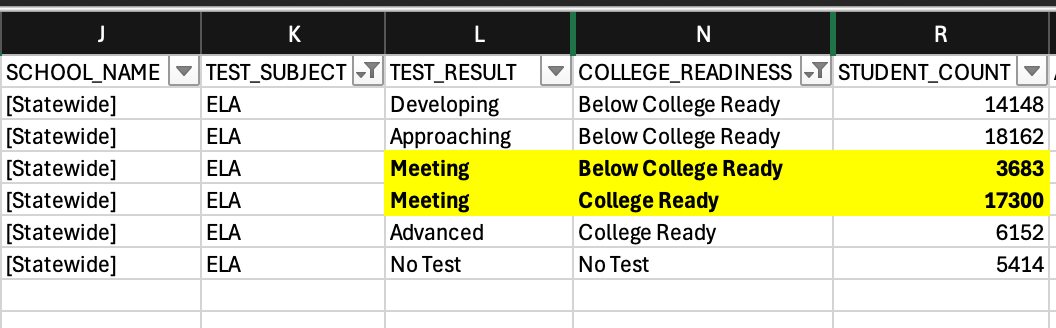
For the ACT, this means that students are now rated as meeting standards with a composite score of 19 - well below the ACT’s College Readiness Benchmark of 22. Statewide, over 7,000 eleventh-graders were in a new category of “Meets Expectations, Below College Ready” in Math.
For the Forward Exam, this means that students are now expected to demonstrate only “partial mastery of the knowledge and skills that are fundamental for proficient work at a given grade.”
More Inequities, Wider Gaps, & Disproportionate Subgroup Impacts: As anticipated by DPI staff, while the new lower standards resulted in across-the-board increases in students rated as meeting standards across all subgroups, these changes had less benefit for historically under-educated groups of students
By race/ethnicity: the percentage change in White students who met the new, lower state standards was 2-3x larger than for Black and Hispanic students.
By family income: the percentage change in non-economically disadvantaged students who met the new, lower state standards was 25% larger than for economically disadvantaged students.
Special Education: the percentage change for non-special education students was 4x as large as for students with identified disabilities.
Milwaukee’s Academic Crisis Persists: Milwaukee’s academic crisis persists, with the gap between overall city and state performance growing by 4 percentage points under the new standards.
In ELA, 28% of students in both public charter and private schools in the Milwaukee Parental Choice Program (MPCP or vouchers) met state expectations, compared to 22% of students in MPS district-operated schools
In Math, 27% of students in public charter schools and 25% of private school students in the Milwaukee Parental Choice Program met state expectations, compared to 16% of students in MPS district-operated schools.
Milwaukee 2023-24 Results
Ordinarily, the majority of this brief would be taken up by this section. We would provide an overview of this year’s results, and we would elevate trends we identified in the data that point to worrying or laudable developments. Because DPI lowered standards this year, that is not possible.
Instead, we will briefly provide this year’s overall numbers for Milwaukee, such as they are. The remaining majority of this brief will aim to put this year’s scores in context, given the lowered standards, and help the reader interpret the results as best we can.
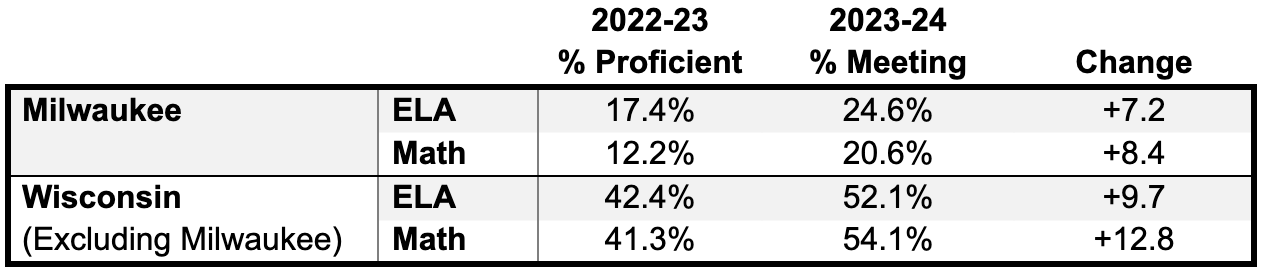
First, Milwaukee’s results—the table below shows the percent of students Meeting or better on the state tests (note that Meeting has replaced Proficient in the state’s language; more on that below). Data includes all tests across all grades.
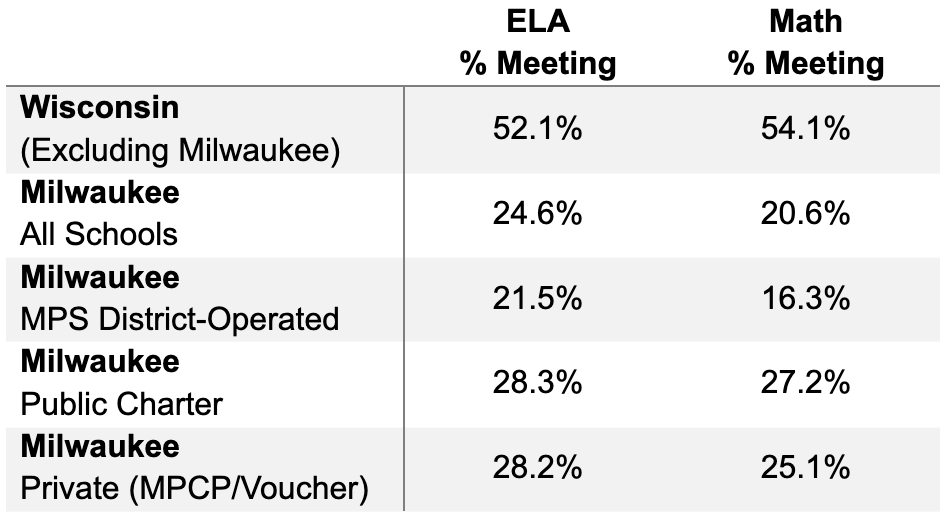
Fewer than 1 in 4 Milwaukee students is Meeting or better–even under the new, lower standard set by DPI. Public charter and private voucher schools score comparably, with charters slightly higher than private schools, and both are above traditional public schools in MPS. The city as a whole remains well behind the rest of the state.
Now, as promised, we will shift to a more instructive conversation that attempts to contextualize the lowered standards.
Moving away from high standards
For more than a decade, Wisconsin’s standards have been among the strongest of any state in the country. Originally set by then-Superintendent Tony Evers, the standards aligned with those of the National Assessment of Education Progress (NAEP), better known as the Nation’s Report Card.
Under those high standards, Wisconsinites could be confident that a student testing as proficient on the state’s tests would be career or college ready when they graduated. Under the new, lower standards, that is no longer the case.
Dr. Jill Underly, the current superintendent, is on record lamenting how Wisconsin’s standards are among the highest in the nation. In the 2023-24 school year, she initiated a process to reset the standards. Specifically, DPI took the following steps:
DPI lowered standards: DPI changed the numerical scale for the test and the cut scores needed to achieve each of the four test results. This means students testing as “meeting” this year does not mean the same thing as students testing “proficient” last year - and
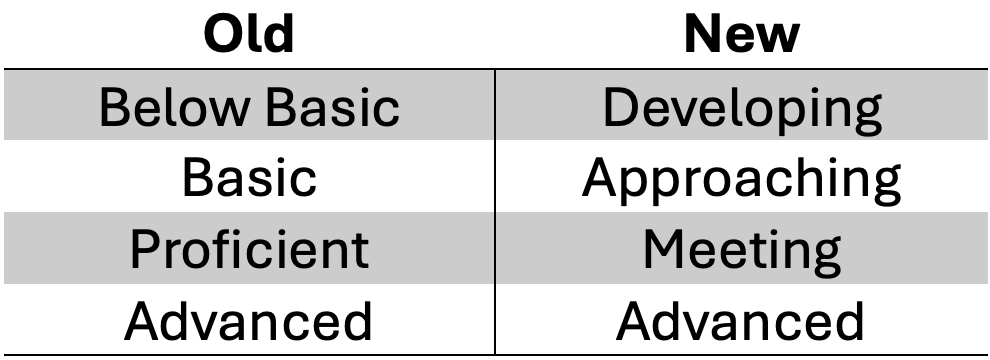
DPI changed its language: DPI changed the assessment level names. These levels bucket students into four groups based on test score, and this is how the state has designated whether students are “proficient” or not. With the new names, students are now designated as “meeting” instead of proficient.
The lowered bar
When we say DPI lowered standards, we mean it made the tests easier to pass. It’s like a 75% on a test last year would have gotten a C, but this year it gets a B. To make matters worse, it’s not clear where on the scale of the new standards a student needs to score to be “on grade level.”
DPI is on record saying that a student meeting grade level expectations is probably somewhere between Approaching and Meeting. Contrary to that assertion, DPI’s own explainer document defines Meeting as:
The student is meeting the knowledge and skill expectations described in the Wisconsin Academic Standards for their grade-level and is on-track for future learning.
That sounds like Meeting is the bar for being on grade-level, but ACT test results indicate that grade level is actually somewhere between Meeting and Advanced, as the officials said.
ACT
DPI’s ACT Statewide certified data reports how many students scored in each test result level. The report also indicates whether students are college-ready. In past years, the top two levels (Proficient and Advanced) were both aligned to be college-ready—students who scored in those levels were college-ready.
This year, however, the Meeting level straddles the line. Some students who score as Meeting are not college ready, while others are.
The ACT can serve as a validation point this year because unlike the Forward exam, the ACT is nationally generated and out of the reach of DPI. This means we can still make year-over-year comparisons using raw ACT scores, and the test therefore serves as our clearest indication that DPI didn’t just reset standards, they lowered them.
Statewide, the ACT average score in ELA was 17.9 this year, down from 18.1 last year. In math, the average score increased from 19.0 last year to 19.1 this year. Though the average ELA score declined, the percentage of students Meeting increased by 4.2 percentage points. The average ACT math score nudged up slightly, and yet the percentage of students Meeting increased by 12.4 points.
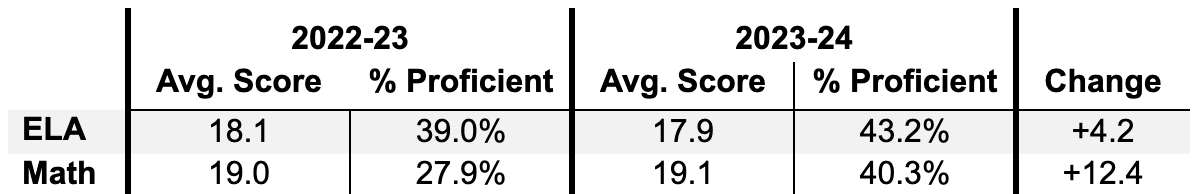
It’s difficult to reconcile these numbers because of how the state lowered standards. Before this year, a Wisconsin student needed a 20 in ELA and a 22 in math to achieve Proficient. Both of these cuts have matched and continue to match ACT’s College Readiness Benchmarks. This year, however, the cut score to achieve Meeting is 19 for both. Since the cut score for math was lowered by a greater magnitude (three points, compared to a single point for ELA), the percentage change for that score is larger than the change for the ELA score.
Forward Exam
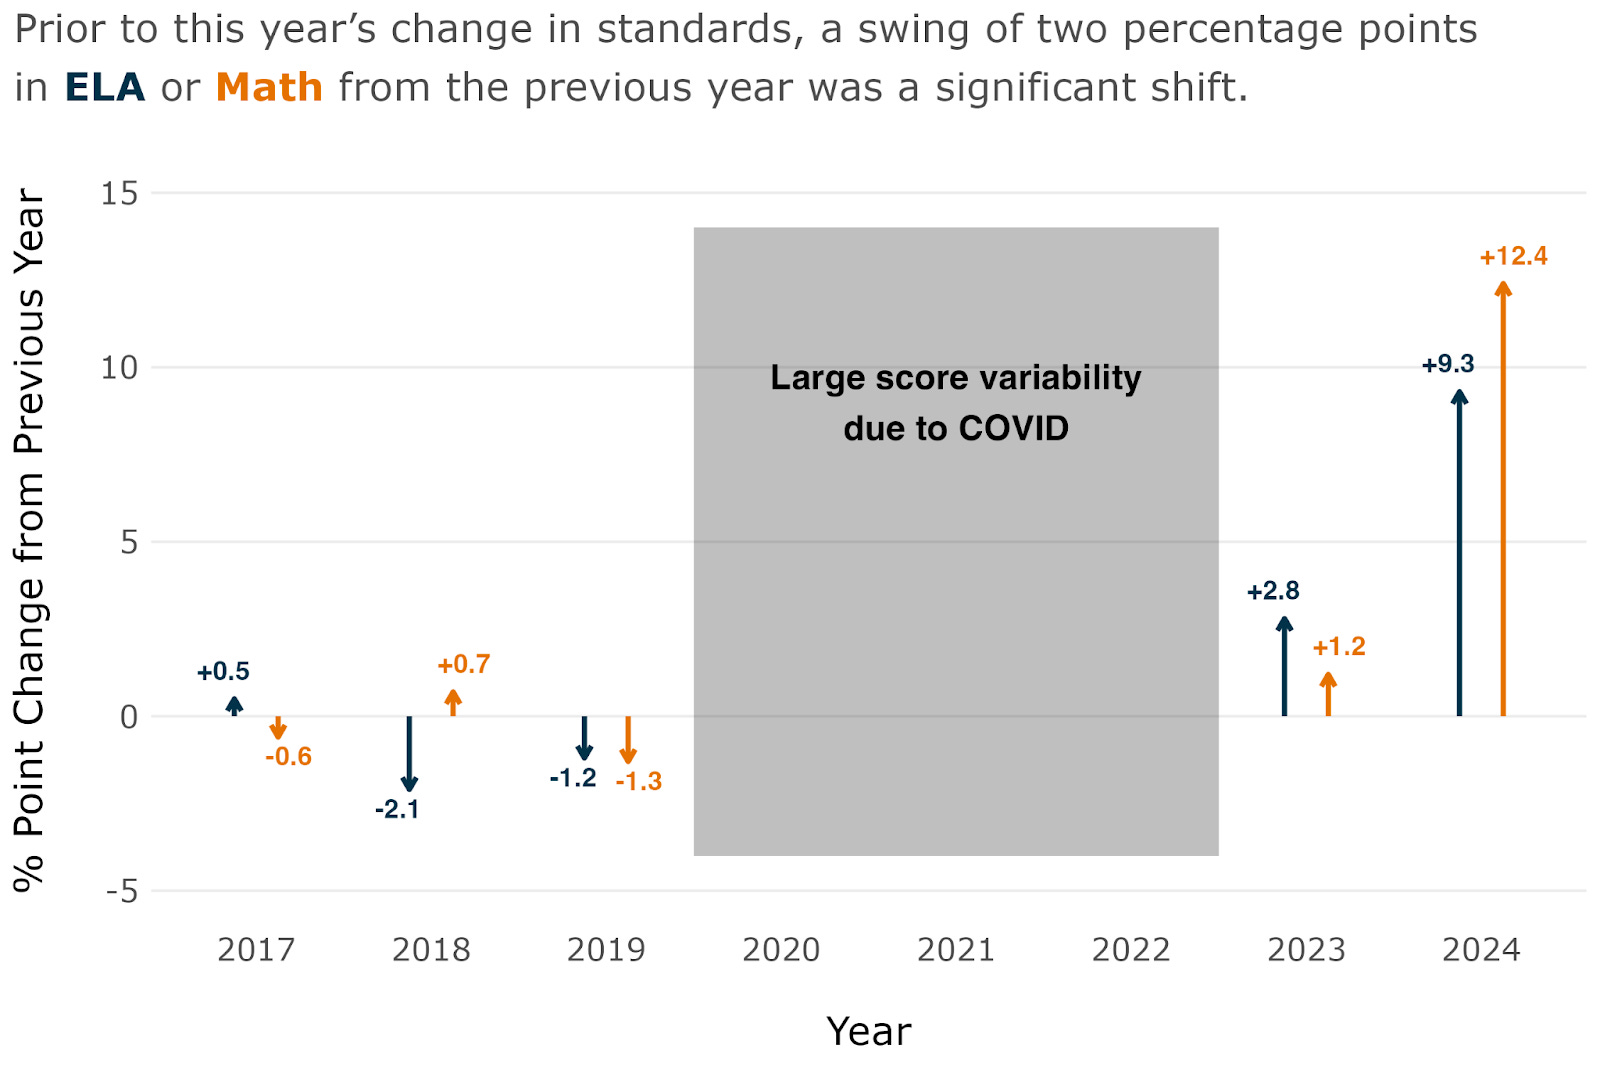
Though we can’t make direct comparisons between Forward Exam results from this year and past years, we can make inferences based on how the scores changed. Statewide, the percent of students scoring Meeting or better was 9.3 percentage points higher than the percent of students scoring Proficient or better last year. In math, scores were 12.4 points higher.

Again, this does not mean that students are doing better than last year—we simply can’t make that determination because of the change in standards. What we can say is that these numbers fluctuate a bit from year to year, but changes are generally of a much more modest degree.
For instance, the statewide percentage point change last year compared to 2021-22 was 2.8 in ELA and 1.2 in Math—and those changes were arguably inflated as test scores were still rebounding from COVID declines. In three years preceding the pandemic, score changes ranged from a decrease of 2.1 points to an increase of 0.7 points.
Changes hurt most vulnerable students most
These changes were not the same for all groups of students. Wealthier white students fared comparatively better under the new, lower standards than historically marginalized groups. For instance, schools in Milwaukee, which serves a student population that is predominantly low-income and non-white, saw more modest gains than their statewide peers.
Testing levels
The reason for this is that a large share of Milwaukee’s students—43% in ELA and 54% in Math—were scoring in the lowest level (Below Basic) under the previous standards. Following the new lowered standards, more of these students moved up one level to Approaching, but this still falls below the threshold of the Meeting standard.
Conversely, the rest of the state had a larger share of students in the Basic level, and the lowered standards helped them reach the Meeting level. The percentage of students scoring in the Approaching level is where we see the greatest divergence between Milwaukee and the rest of the state, and the second greatest is in the Advanced level.
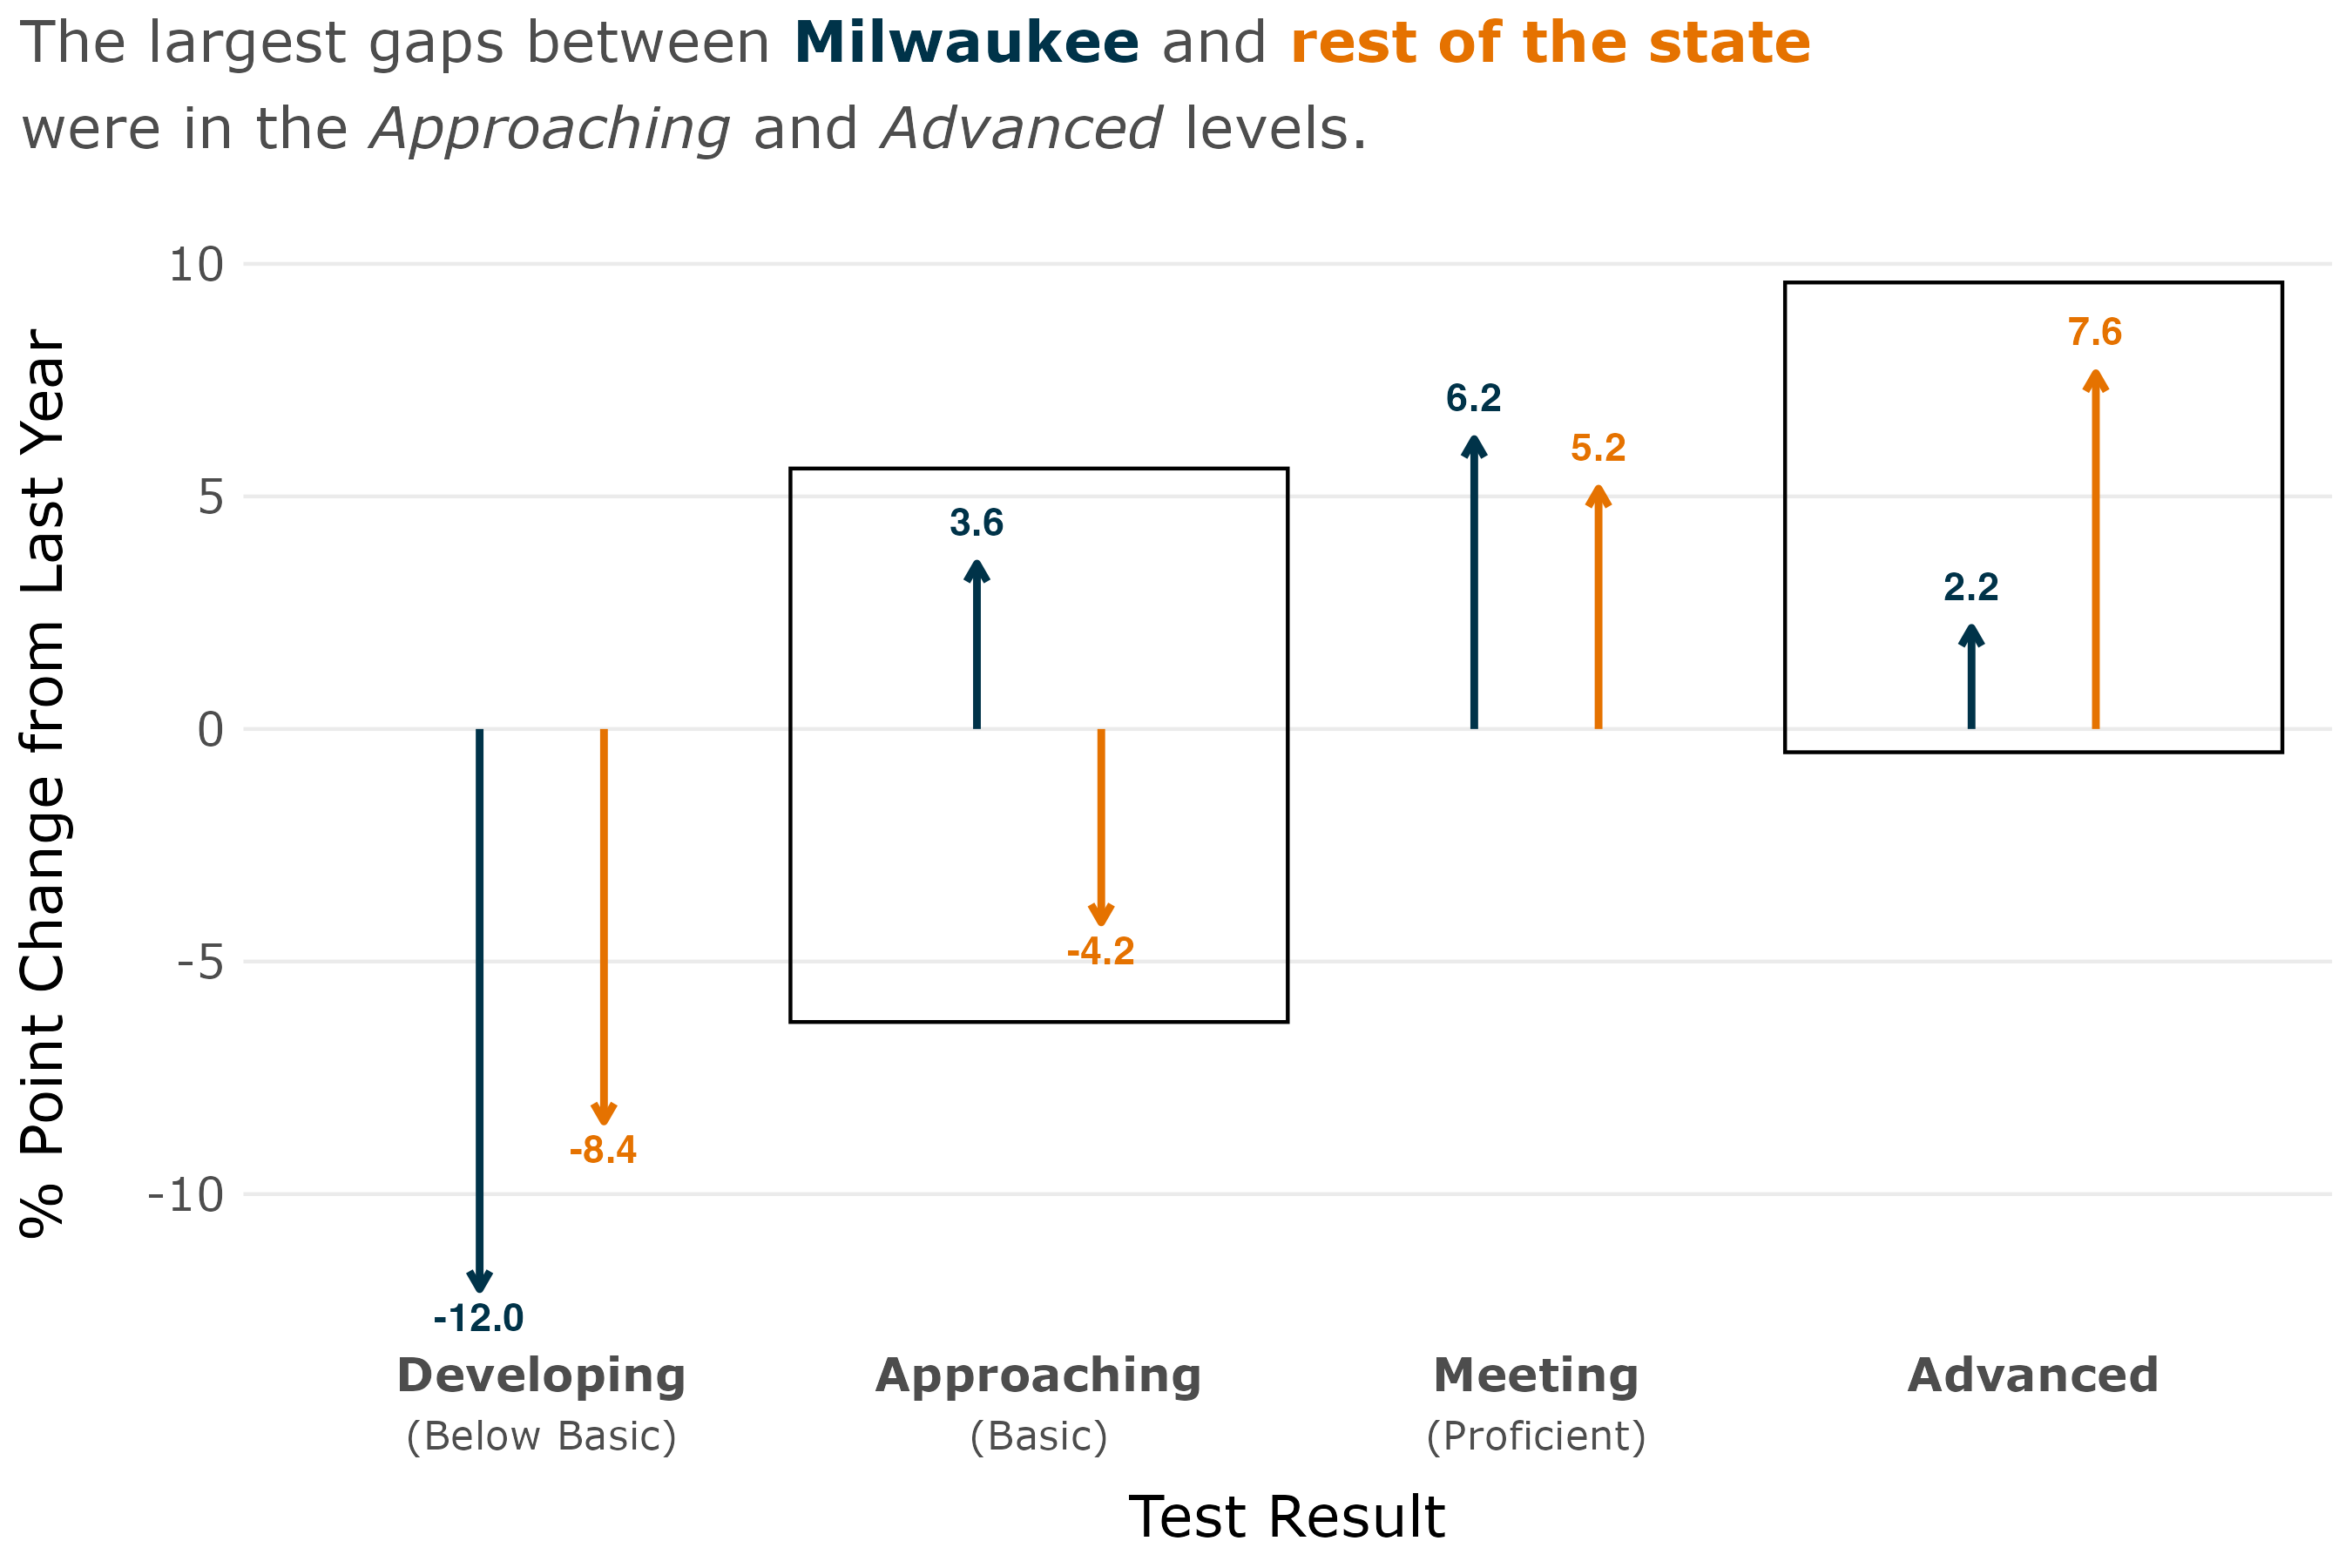
The share of students in the Approaching level increased in Milwaukee as students were bumped up from the lowest level (Meeting), while a commensurate share of students was not also bumped up from Approaching to Meeting. Outside of Milwaukee, a large enough share of students moved from Approaching to Meeting–or even up two levels from Developing to Meeting–to offset the share moving from Developing to Approaching.
Student groups
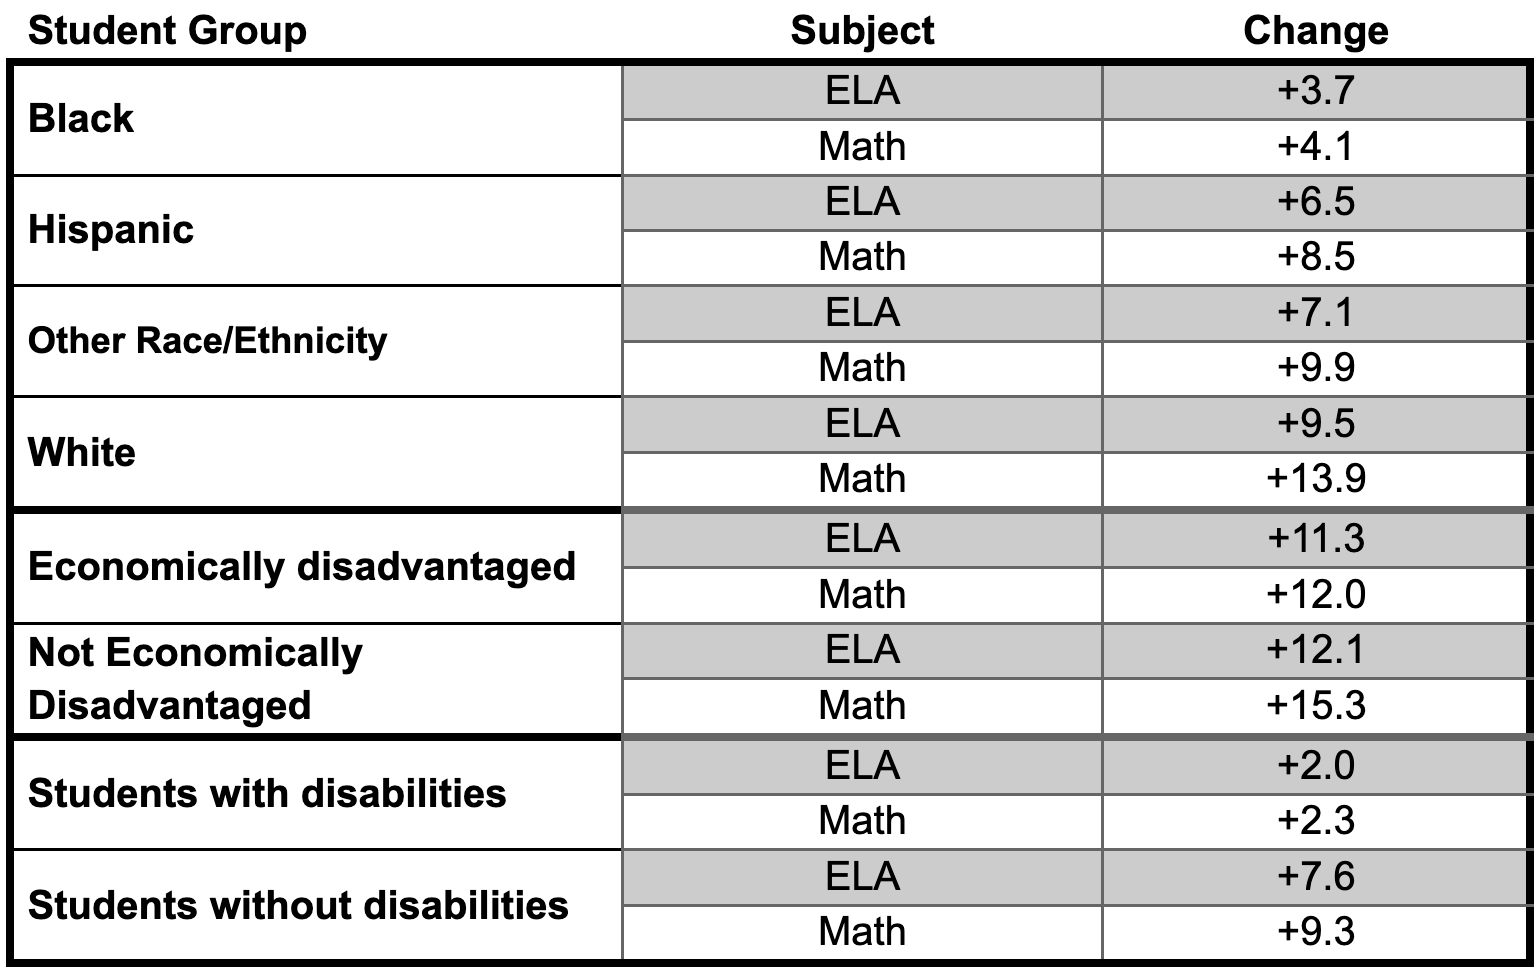
The widening of the gap is not limited to the gap between Milwaukee and the rest of the state. In ELA, the share of Milwaukee Black students Meeting or better increased by 3.7 percentage points, while the same rate for white students increased by 9.5 points. In math, Black students’ scores increased by 4.1 points, and white students increased by 13.9 points.
The same can be said of Hispanic students, Economically Disadvantaged students, and students with disabilities compared to their more advantaged peers. To differing degrees, the lowered standards were more beneficial to traditionally advantaged groups of students.
Conclusion
It’s hard to overstate the impact of this year’s changes to assessment standards. The changes lowered Wisconsin’s previously-rigorous standards, and it made test results harder to interpret. Not only is it impossible to make comparisons with past years and analyze trends (especially important as schools continue to recover from COVID), but it is also unclear what test results tell us in terms of whether a student is on track to graduate with the knowledge and skills necessary to succeed in college or a career.
On top of everything else, the changes essentially broke how the School and District Report Cards work. The details here are outside the scope of this post, but the end result is that DPI will be adjusting the Report Card scoring methodology this year AND next year. To put it another way, this year’s Report Cards will be different from last year’s, and next year’s will be different from this year’s. Assuming there are no further changes, we will have to wait three years from now to have Report Cards we can compare with the previous year.
We will have more to say on this matter when Report Cards are released next month, and we will continue to advocate for high standards and the quality of education that every Milwaukee student deserves.
Methodology Notes
City Forward Collective’s definition of the school sectors reflect the following:
MPS District-Operated Schools: these are schools under the direction of the MPS superintendent and staffed by MPS; these include traditional public schools and instrumentality charter schools
Public Charter Schools: these public schools are either authorized by an independent authorizer (i.e., 2r/2x charters) or non-instrumentality charter schools authorized by a public school district
Private MPCP/Voucher Schools: these private schools participate in the Milwaukee Parental Choice Program and are either a) located within the city of Milwaukee, or b) serve a student population of which at least 75% are MPCP students
We source all of our data from public DPI data reports. These reports have limitations such as data redactions in cases where the group of students is fewer than 20 students. While these reports are our best source of information, we believe it is important to note their limitations.